Python apps
Interactive tools for exploration, statistical analysis, and repeatable workflows.
Exploring social and economic trends through data and visual storytelling.
Interactive tools for exploration, statistical analysis, and repeatable workflows.
Visual analytics designed for comparison, navigation, and readable storytelling.
Featured work
Python Viz
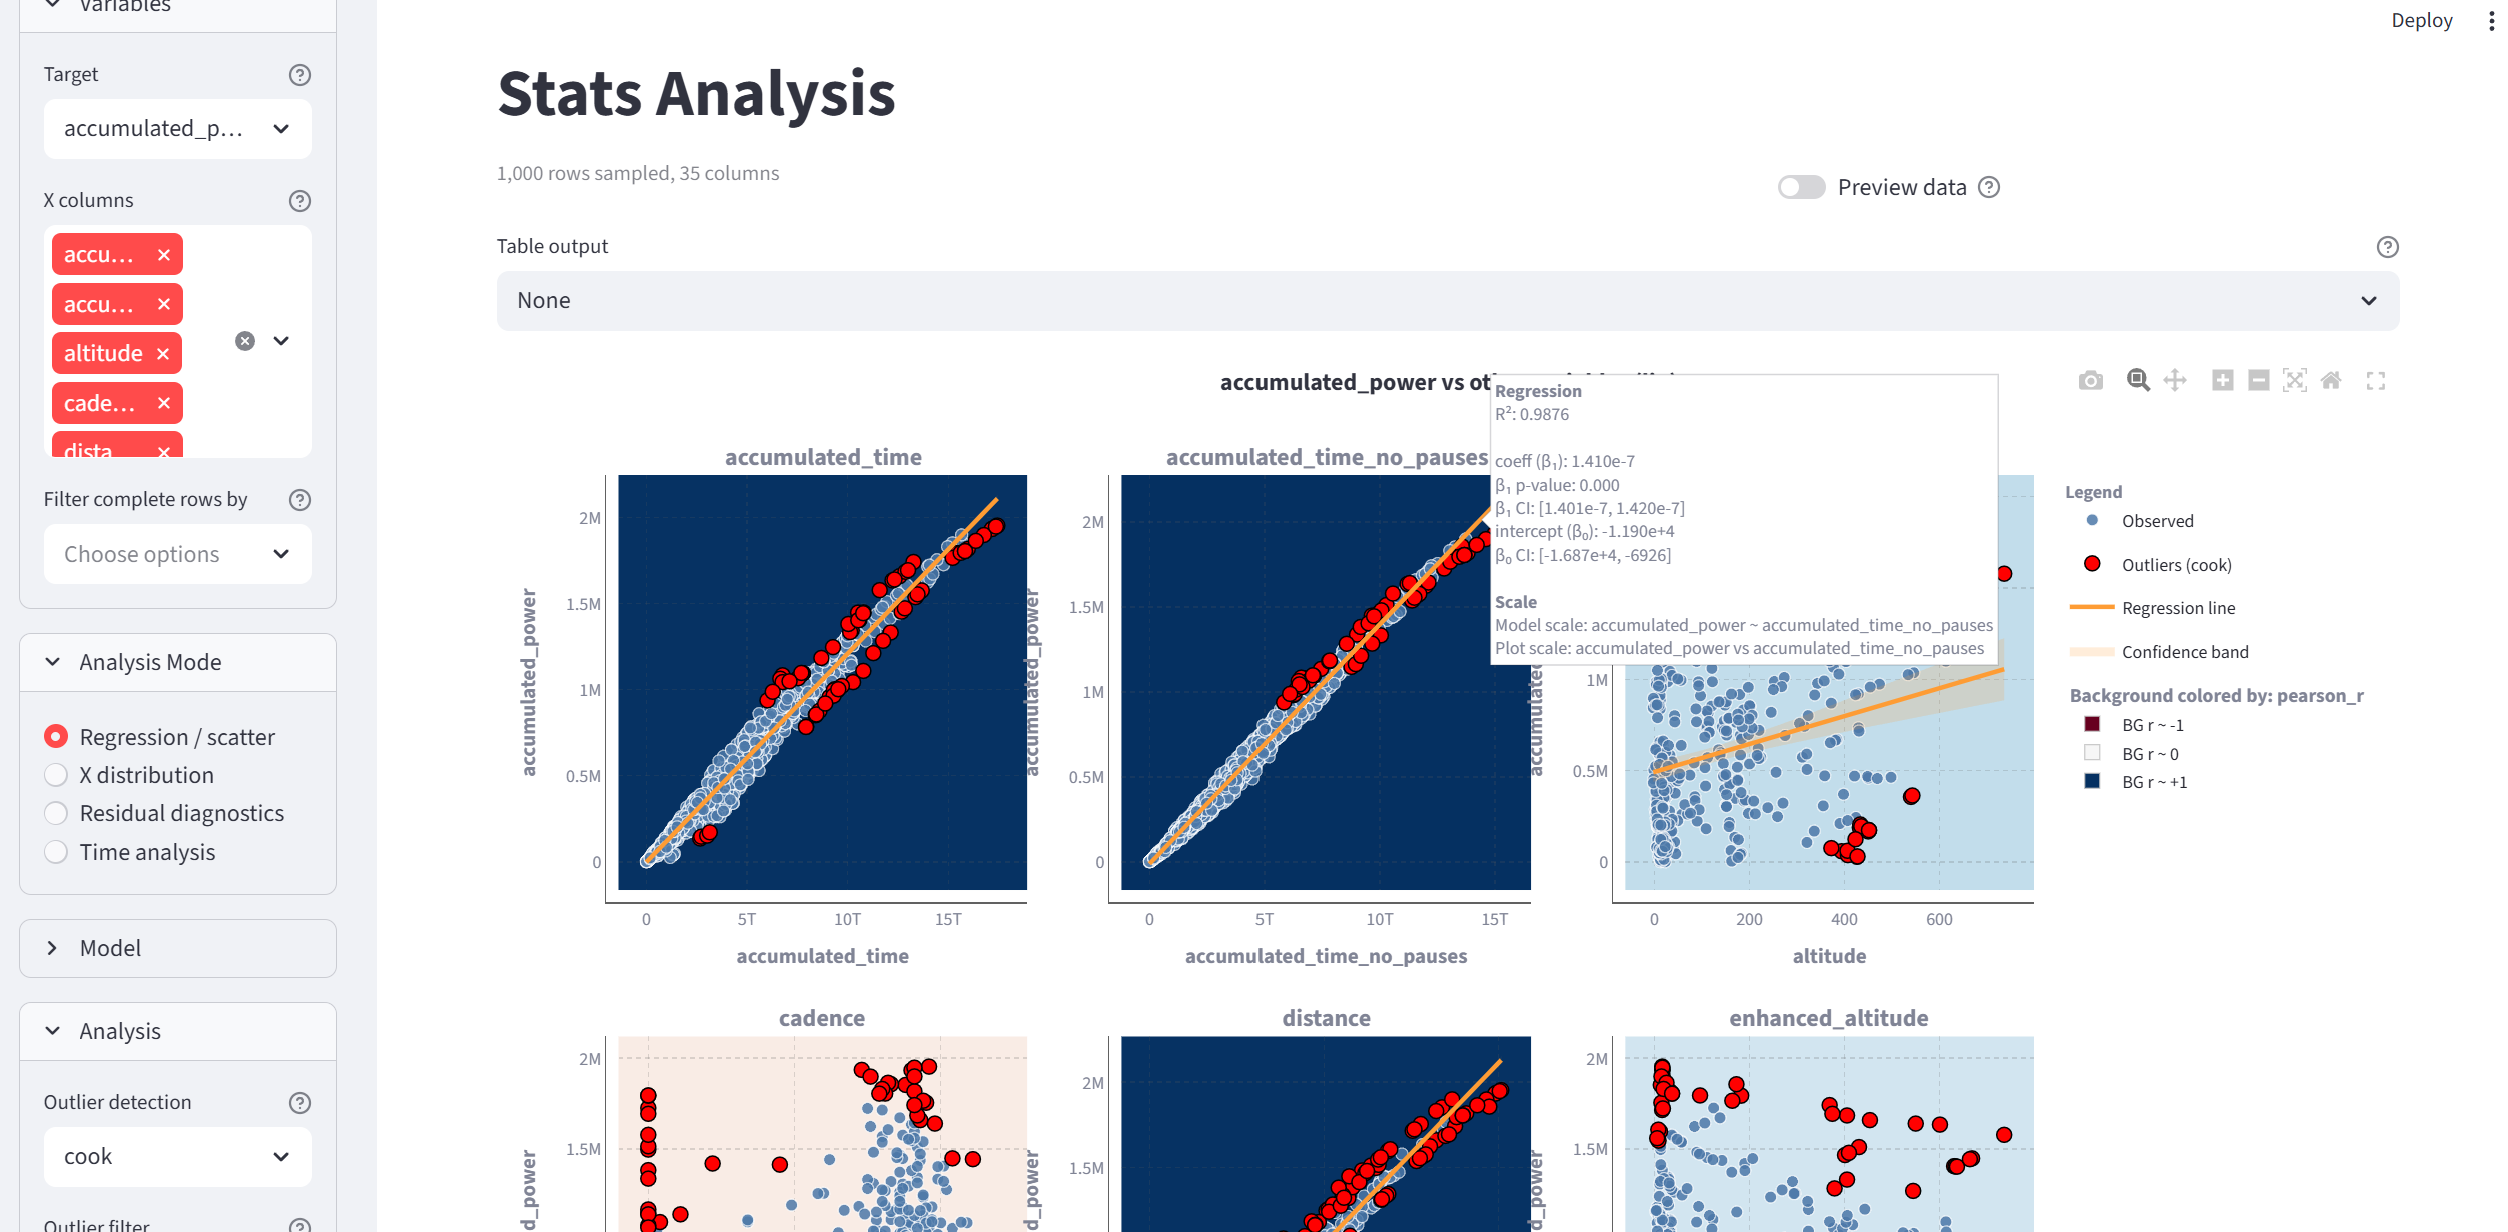
Interactive Streamlit application for exploratory statistical analysis, regression diagnostics, residual analysis, and time series visualization.
View project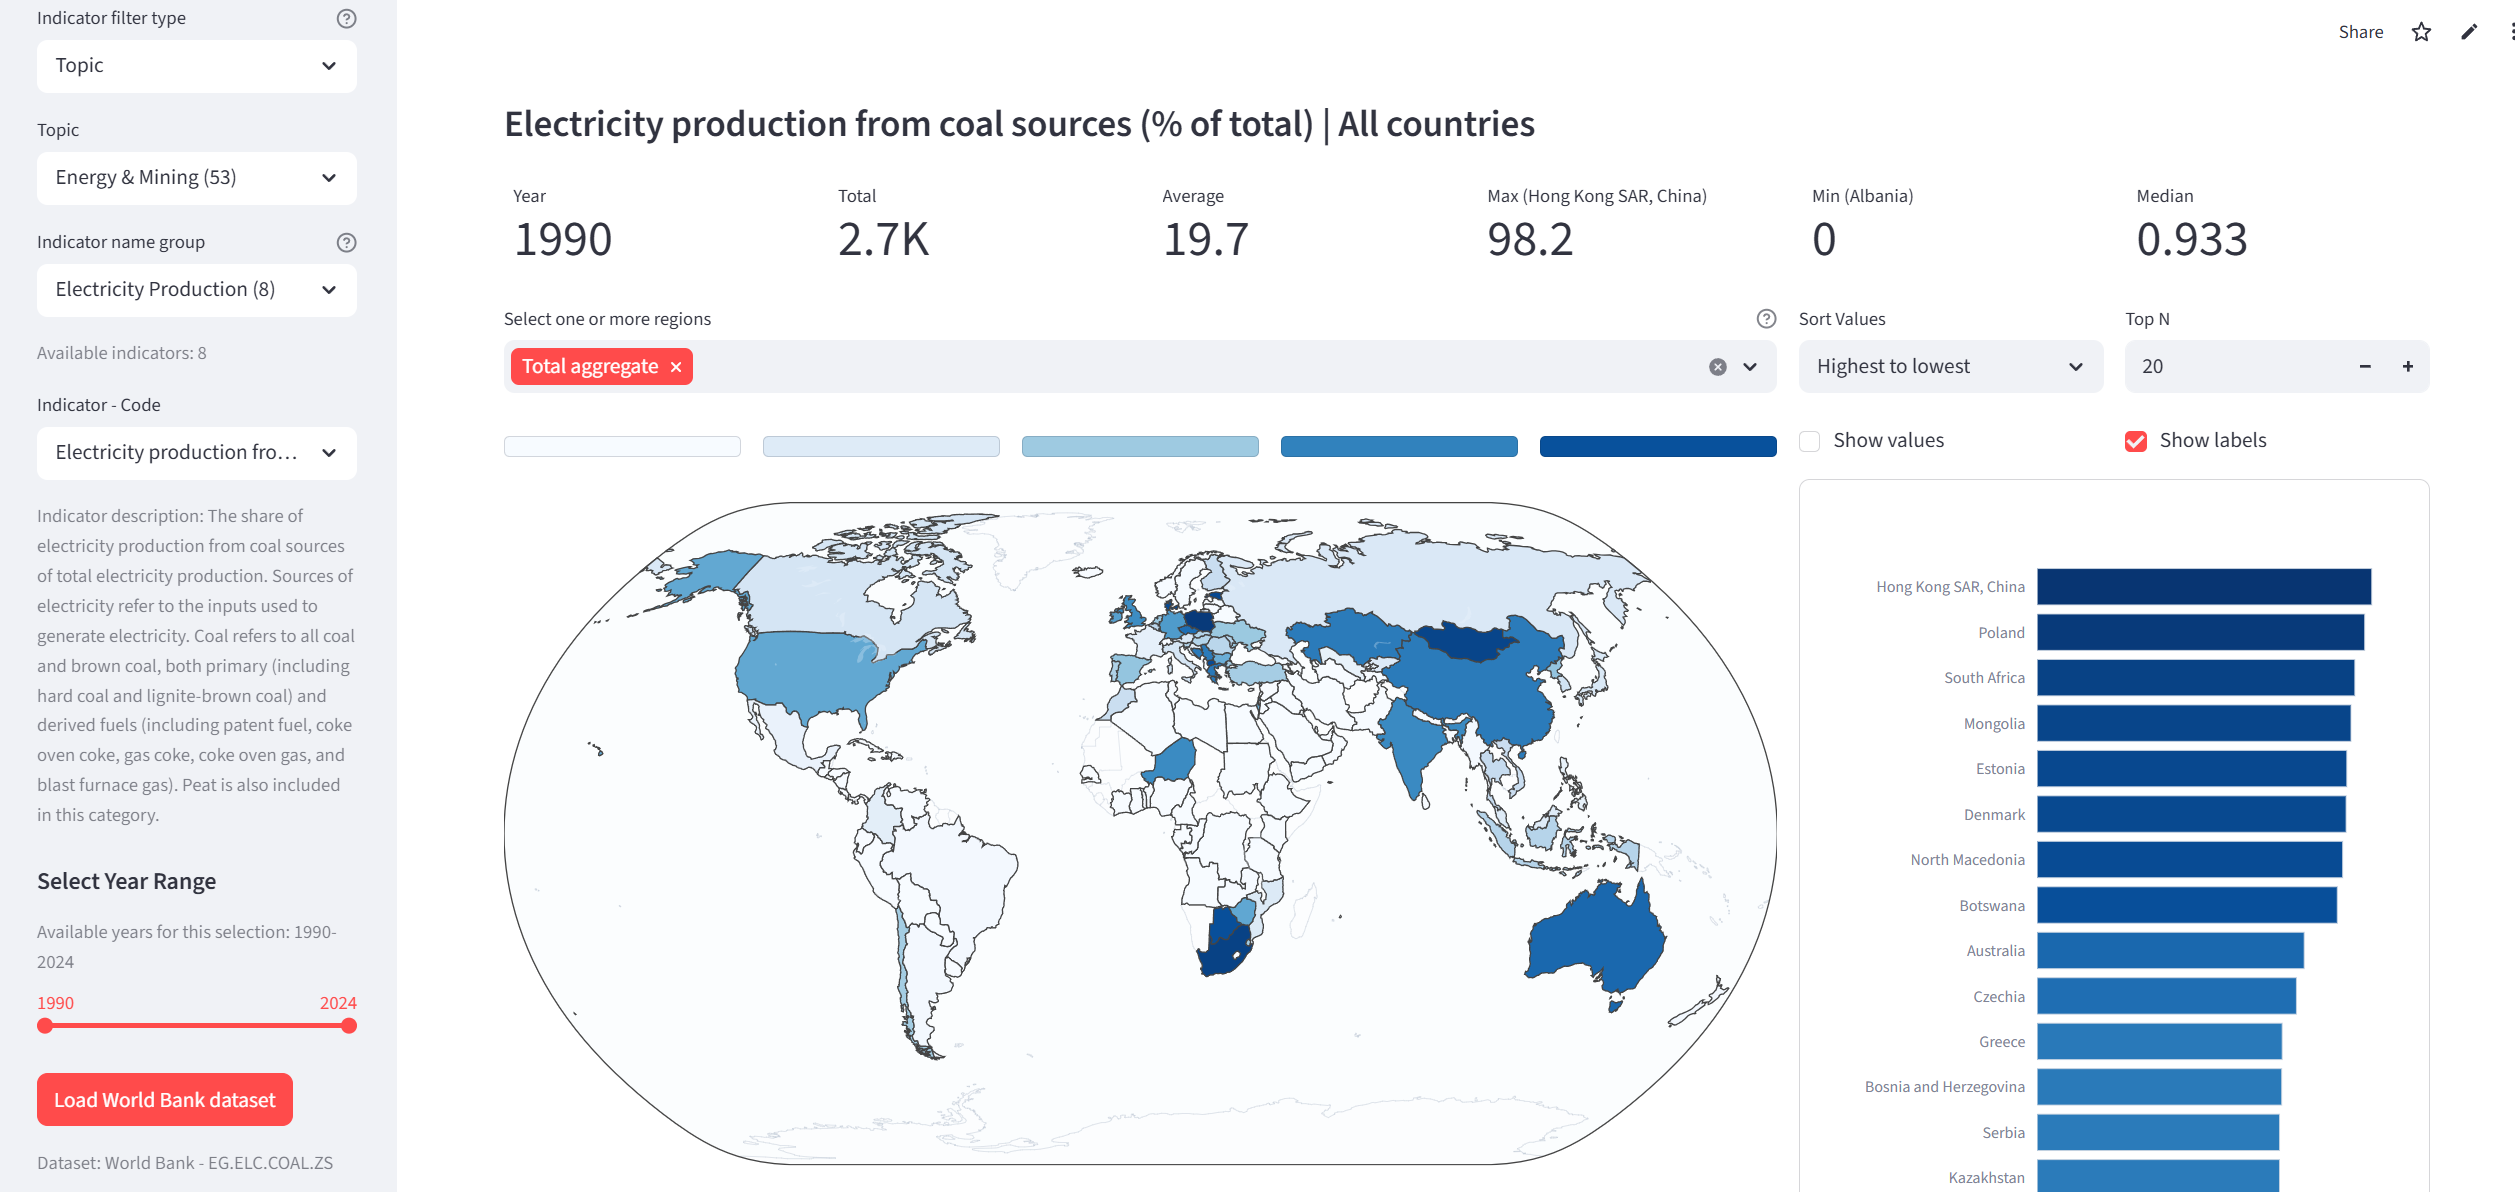
Python Viz
Interactive Python application for geographic exploration, spatial comparison, and visual analysis of territorial data, available in both Streamlit and Dash versions.
View project
Tableau Viz
Storytelling project on electoral abstention over time across democratic countries, combining political science framing and visual analytics.
View projectTools / stack
I use statistical thinking and visual analysis to explore social and economic trends, turning complex data into clear narratives, interactive tools, and evidence that can be understood at a glance.
Read more