Python Viz
Interactive apps, statistical workflows, and exploratory analysis tools.
Work
A curated portfolio of analytical tools, dashboards, and reports. The first version starts small, with room to add stronger project pages as the work grows.
Interactive apps, statistical workflows, and exploratory analysis tools.
Dashboards and visual analytics built for comparison and storytelling.
Python Viz
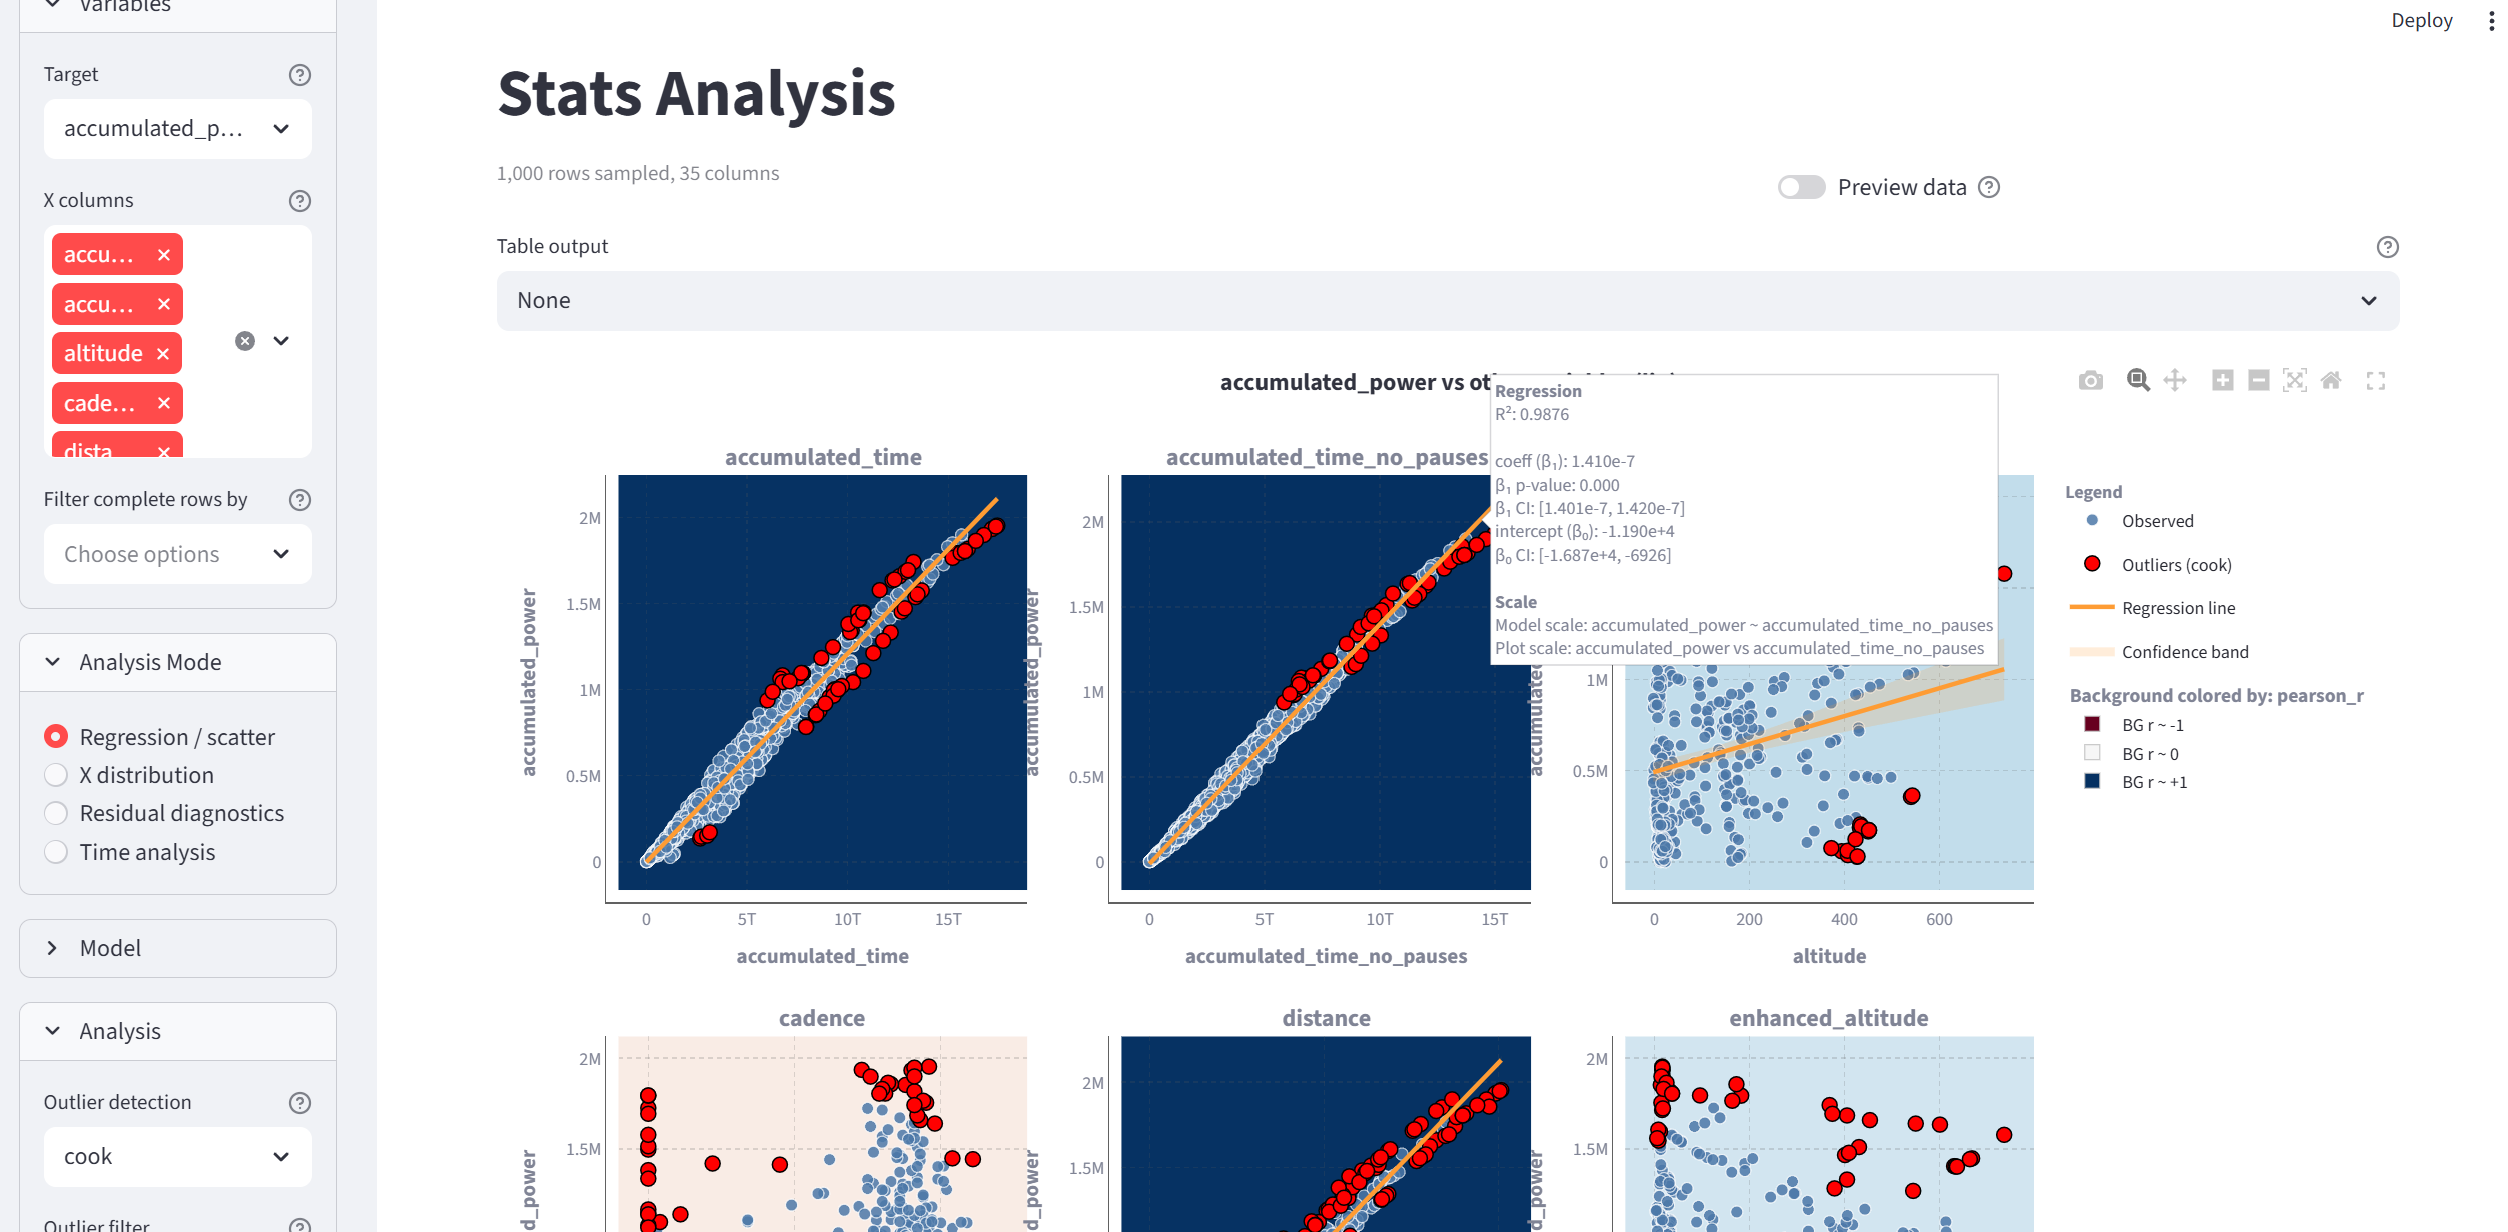
Interactive Streamlit application for exploratory statistical analysis, regression diagnostics, residual analysis, and time series visualization.
Python Viz
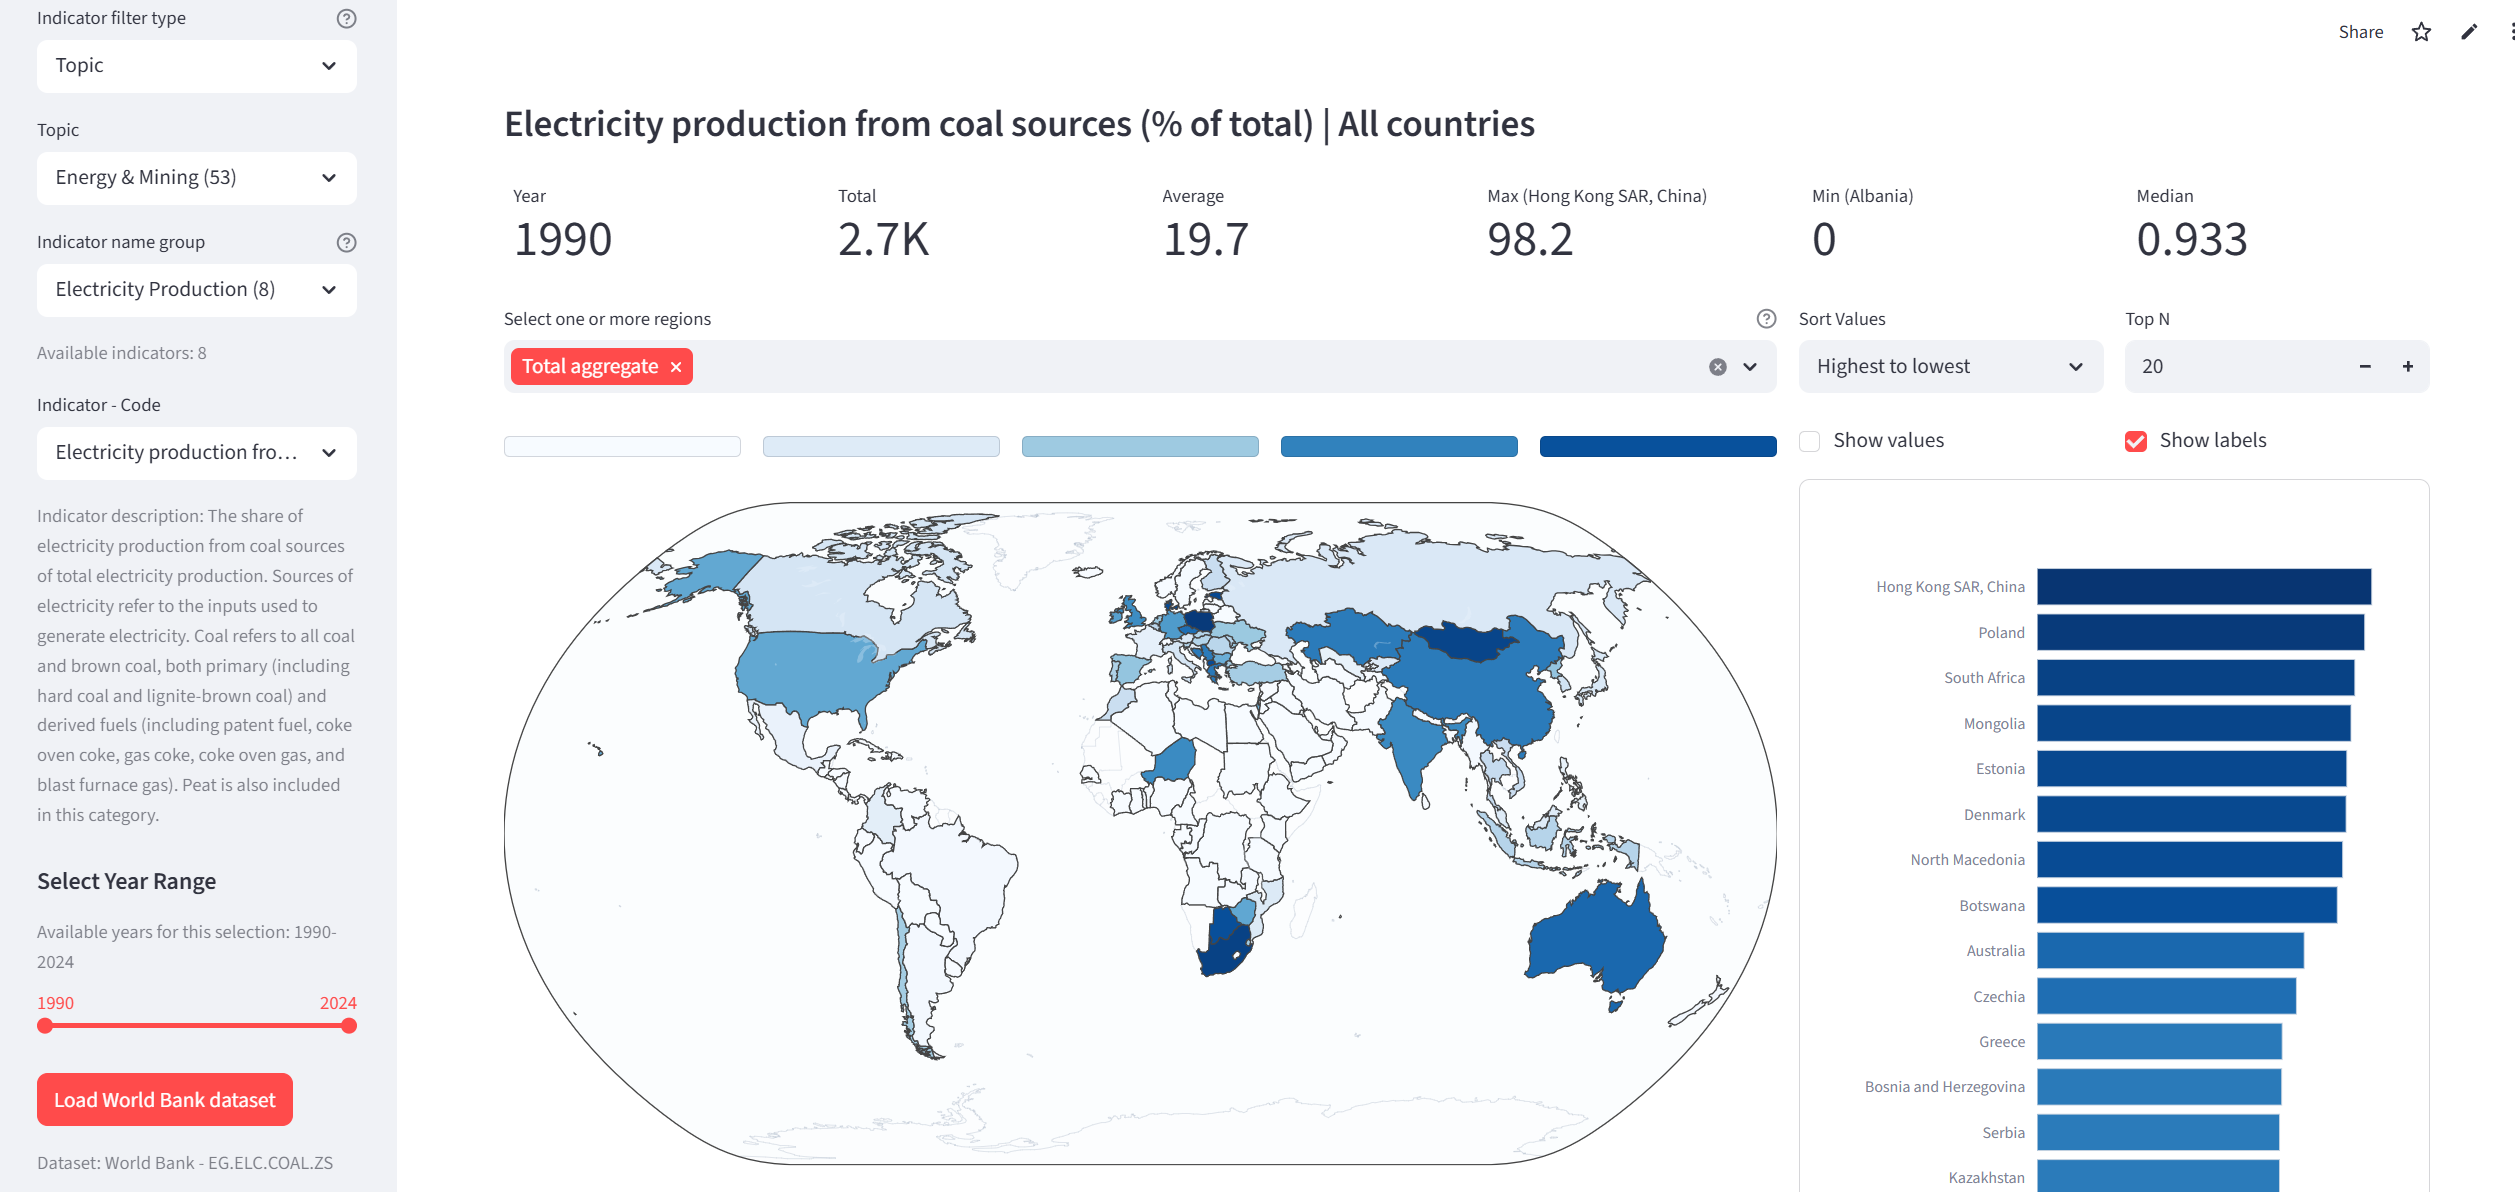
Interactive Python application for geographic exploration, spatial comparison, and visual analysis of territorial data, available in both Streamlit and Dash versions.
Tableau Viz
Storytelling project on electoral abstention over time across democratic countries, combining political science framing and visual analytics.